Filter dashboard data
On the Dashboard screen, you can filter your charts for a more clear visualization of your data. To do so, you have different options:
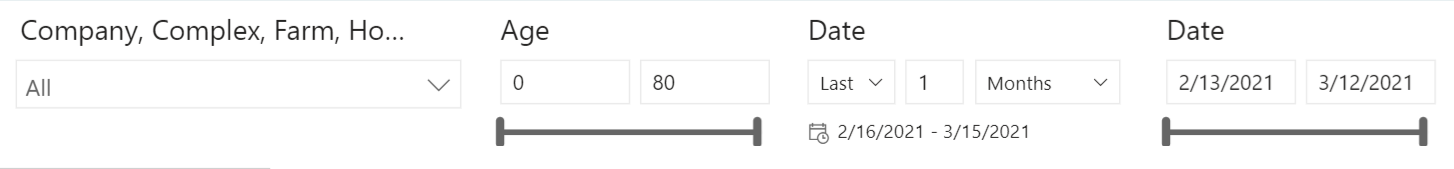
- You can filter the charts using the Dashboard filters available at the top of the screen. Most of these filters appear on each detail screen (see Filter charts using the dashboard filters).
- You can filter the charts by clicking the charts themselves or clicking the toolbar which appears when you hover over the charts (see Filter charts on figures).
- You can filter the charts using the Filters pane at the right-hand side. This filtering is more advanced and specific (see Filter charts using the Filters pane).
Tip: Your filters will remain active as long as you stay on the Dashboard tab.