Quick charts reports
On the Quick charts Home screen, you can easily generate quick charts reports that give you an overview of all health data that you logged for one single visit date. Quick charts are pre-formatted graphs that display the scoring results of multiple flocks for each individual health module that you scored when visiting these flocks.
When you open the Quick charts report for a specific visit date, you can:
- View the flock information of all flocks that you visited that day
- View and modify the quick charts of each individual health module component that you scored
- Export a quick chart to a PNG file
- Export a quick charts report to a Word file
- Export the data of multiple health reports to an Excel file
On the quick chart of each health module, you can see:
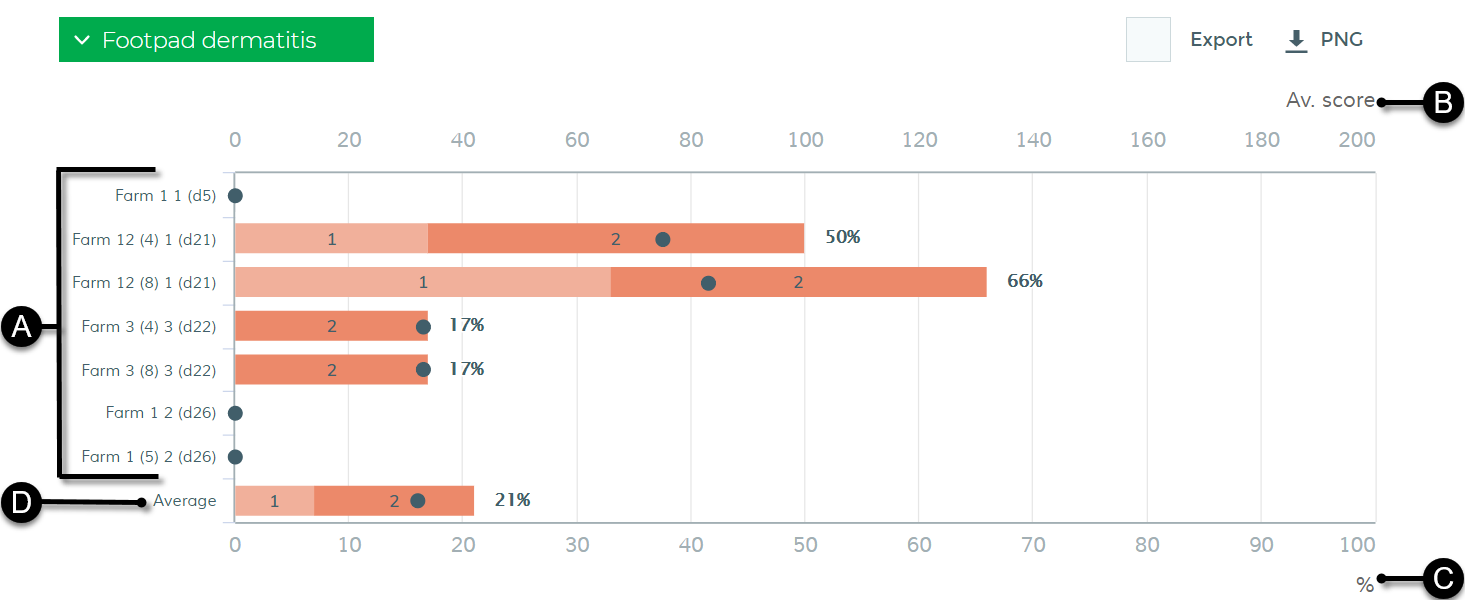
- A
- The flocks that you scored
- B
- The Av. Score or "Total" (see section Open and edit a health report) of each flock
- C
- The Scored positive score or the prevalence (%) in each flock
- D
- The average of all flocks
Tip: You can hover your cursor over the graph to see the actual values.