Climate

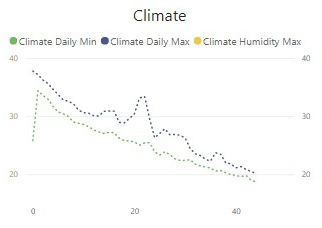
This line chart shows the min and max temperature (°C) and humidity (%) according to the flock age, averaged over all the flocks filtered.
Tip: Click Climate Daily Min, Climate Daily Max or Climate Humidity Max to filter the shown results.
