Averages dashboard screen
The Flock results visualizes information such as feed conversion (FCR) and European production efficiency factor (EPEF), average daily gain (ADG) and total mortality (%). You can access the Flock results details screen by clicking the Averages heading on the Dashboard Home screen.
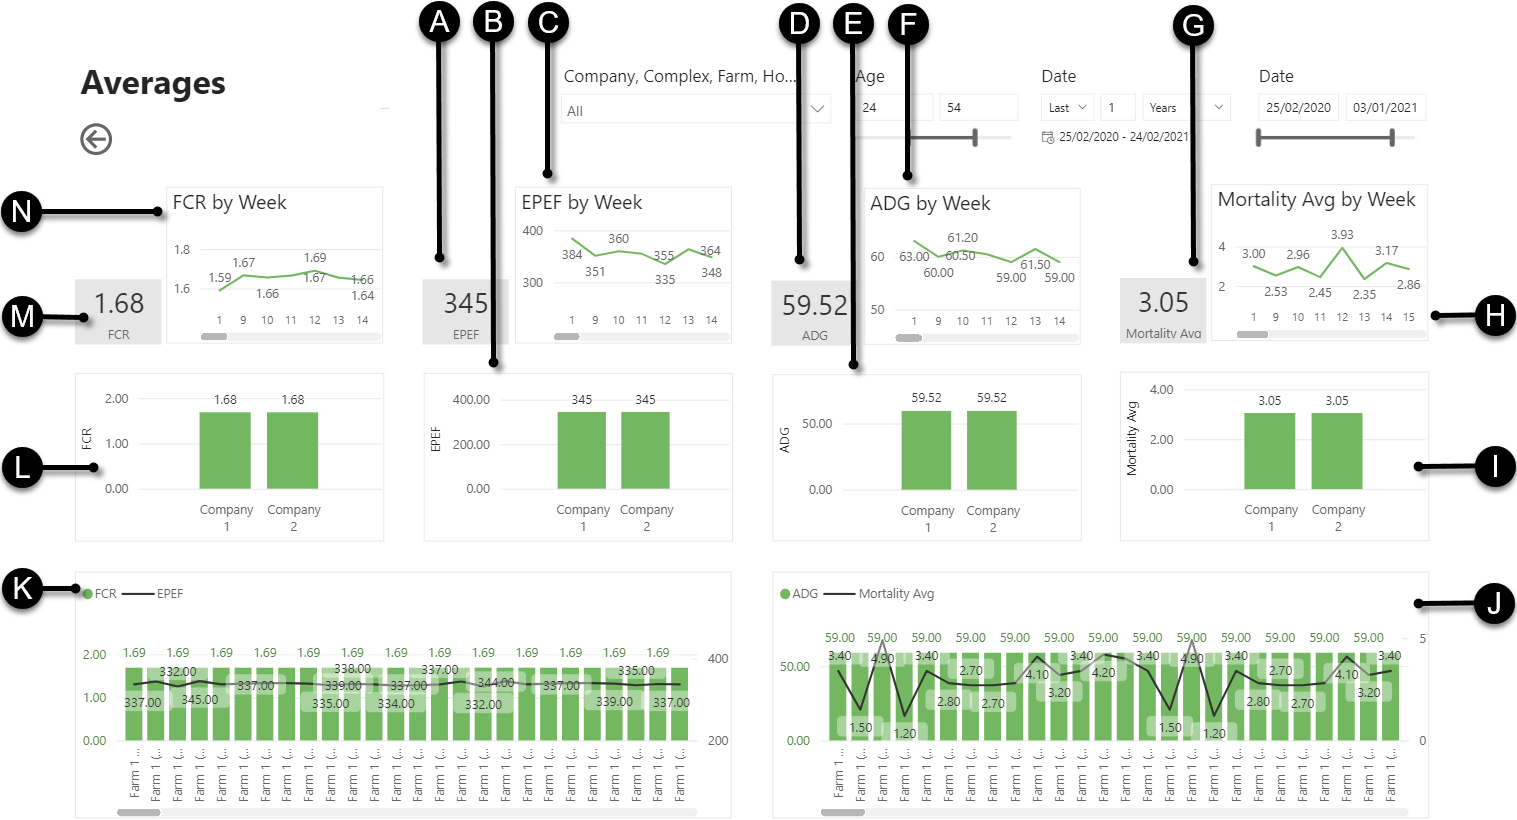
- A
- EPEF overall average card
- B
- EPEF bar chart per Client structure (Company, Complex, Farm, Flock)
- C
- EPEF evolution in time (Year, Month, Week, Age (of bird)) line chart
- D
- ADG overall average card
- E
- ADG bar chart per Client structure (Company, Complex, Farm, Flock)
- F
- ADG evolution in time (Year, Month, Week, Age (of bird)) line chart
- G
- Mortality overall average card
- H
- Mortality evolution in time (Year, Month, Week, Age (of bird)) line chart
- I
- Mortality bar chart per Client structure (Company, Complex, Farm, Flock)
- J
- ADG and Mortality (%) bar chart per Farm, House, Flock
- K
- FCR and EPEF bar chart per Farm, House, Flock
- L
- FCR bar chart per Client structure (Company, Complex, Farm, Flock)
- M
- FCR overall average card
- N
- FCR evolution in time (Year, Month, Week, Age (of bird)) line chart
Note: Change the variable on the x-axis by using the drill-down function (see Filter charts using the chart toolbar).
You can filter the charts on:
- Parts of your company: see Filter charts by company parts
- Slaughter age range: see Filter charts by ageNote: If the age at slaughter is not specified when creating the General Flock Report, Aviapp will take the archiving age.
- A particular period and optionally an exact date: see Filter charts by date
Tip: You can hover over the bars of the charts to view the corresponding values.