Skeletal

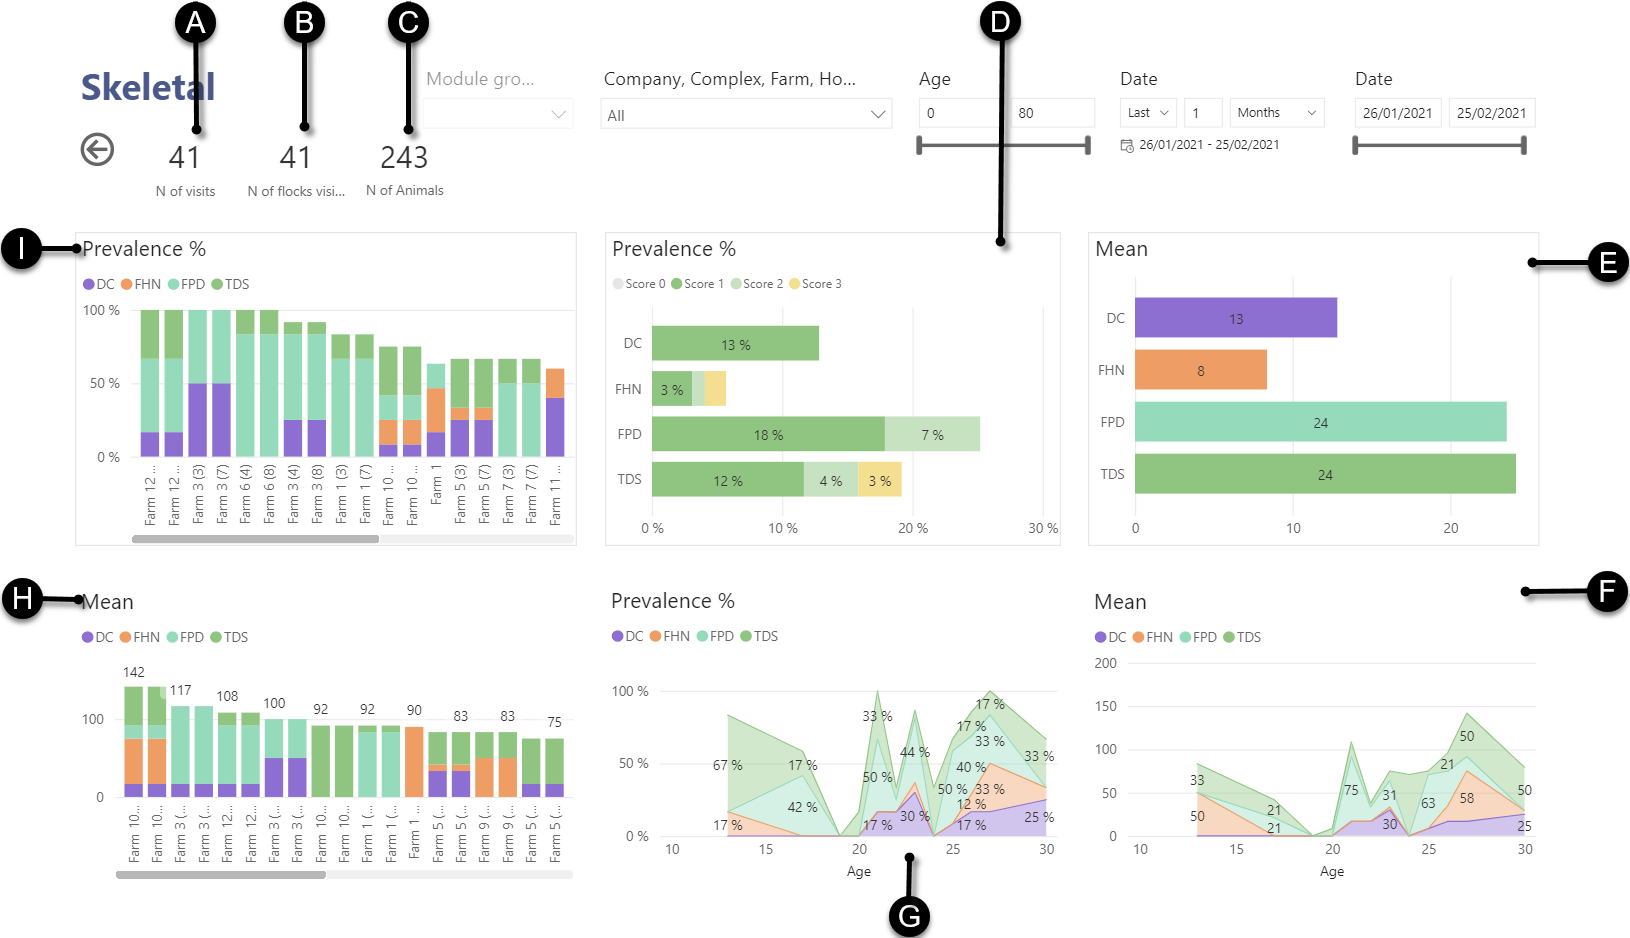
- A
- Number of visits
- B
- Visited number of flocks
- C
- Number of birds
- D
- Prevalence percentage of each score for each module.
- E
- Mean score of each module.
- F
- Mean score of each module in function of Year, Month, Week, Date or Age (of bird).Note: The default variable for the x-axis is Age (of bird). Change this variable by using the drill-down function (see Filter charts using the chart toolbar).
- G
- Prevalence percentage of each module in function of Year, Month, Week, Date or Age (of bird).Note: The default variable for the x-axis is Age (of bird). Change this variable by using the drill-down function (see Filter charts using the chart toolbar).
- H
- Mean score of each module for each Farm, Flock. Note: Mean scores are stacked per Farm. To expand to Flock, use the drill down (see Filter charts using the chart toolbar).
- I
- Prevalence percentage of each module for each Company, Complex, Farm, House no or Flock. Note: The prevalence percentage is the number of flocks that scored positive for each module divided by the total amount of flocks. Change the variable on the x-axis by using the drill-down function (see Filter charts using the chart toolbar).
The different modules shown in the skeletal charts are:
Tip: You can hover over the bars of the charts to view the corresponding values.
